Annual UK Annual Tax on Enveloped Dwellings statistics commentary
Updated 28 March 2024

© Crown copyright 2024
This publication is licensed under the terms of the Open Government Licence v3.0 except where otherwise stated. To view this licence, visit nationalarchives.gov.uk/doc/open-government-licence/version/3 or write to the Information Policy Team, The National Archives, Kew, London TW9 4DU, or email: psi@nationalarchives.gov.uk.
Where we have identified any third party copyright information you will need to obtain permission from the copyright holders concerned.
This publication is available at https://www.gov.uk/government/statistics/uk-ated-statistics/annual-uk-ated-statistics-commentary
About this release
This publication provides annual statistics on receipts and liable declarations for Annual Tax on Enveloped Dwellings (ATED) for the period up to 31 March 2023. These statistics cover the whole of the UK. Data is split by price band, region, local authority, and type of relief. For definitions, guidance and references see the published tables (spreadsheet) that accompany this document.
These statistics are non-accredited official statistics. They follow the professional standards in the Code of Practice for Statistics.
Background about Annual Tax on Enveloped Dwellings
Introduced in April 2013 to combat avoidance of Stamp Duty Land Tax, the Annual Tax on Enveloped Dwellings (ATED) is a recurring annual charge on UK residential property held in a ‘corporate envelope’ (a company for example).
How does ATED apply
ATED is a tax charged on ‘non-natural persons’ (typically companies) that own an interest in one or more UK residential properties valued above a certain amount. An ATED return must be completed where:
The property is completely or partly owned by a non-natural person - that is, a company, a partnership where any of the partners is a company, or a ‘collective investment scheme’ (for example, a unit trust or an open-ended investment company); and is valued at more than:
-
£2 million, for returns from April 2013 onwards
-
£1 million, for returns from April 2015 onwards
-
£500,000, for returns from April 2016 onwards
The annual ATED charge is based on the value of the property on a fixed 5 yearly valuation date, or the price at acquisition if that was more recent. For the 5 financial year periods up to 2017 to 2018, the valuation date was 1 April 2012. For the 5 financial year periods up to 2022 to 2023 the valuation date was 1 April 2017.
Main summary
The headline findings in this annual report are:
-
total ATED receipts in the 2022 to 2023 financial year were £124 million, increasing by 4% (£5 million) compared to the previous year
-
the 2022 to 2023 financial year follows an increase in total ATED receipts in the previous year, which was the first year since the 2015 to 2016 financial year in which ATED receipts had risen
-
the number of liable ATED declarations in the 2022 to 2023 financial year was 4,800, marginally decreasing (less than 1%) compared to the previous year, with the largest change a 7% decrease for the £10 million to £20 million price band compared to the 2021 to 2022 financial year
-
the majority of ATED receipts are from London (85%), remaining unchanged when compared to the 2021 to 2022 financial year
-
the local authority with the greatest share of ATED receipts in financial year 2022 to 2023 remains Westminster (48%), followed by Kensington and Chelsea (23%)
-
the number of relief declarations made in financial year 2022 to 2023 was 22,770, marginally decreasing (less than 1%) when compared to 2021 to 2022
-
this is the first year since ATED’s introduction that relief declarations have fallen
-
the type of relief comprising the largest share of relief declarations is rental relief, which accounts for 84% of all relief claims. Rental relief claims saw a 6% increase in number of claims in the financial year 2022 to 2023 compared to financial year 2021 to 2022
Estimated ATED receipts by band
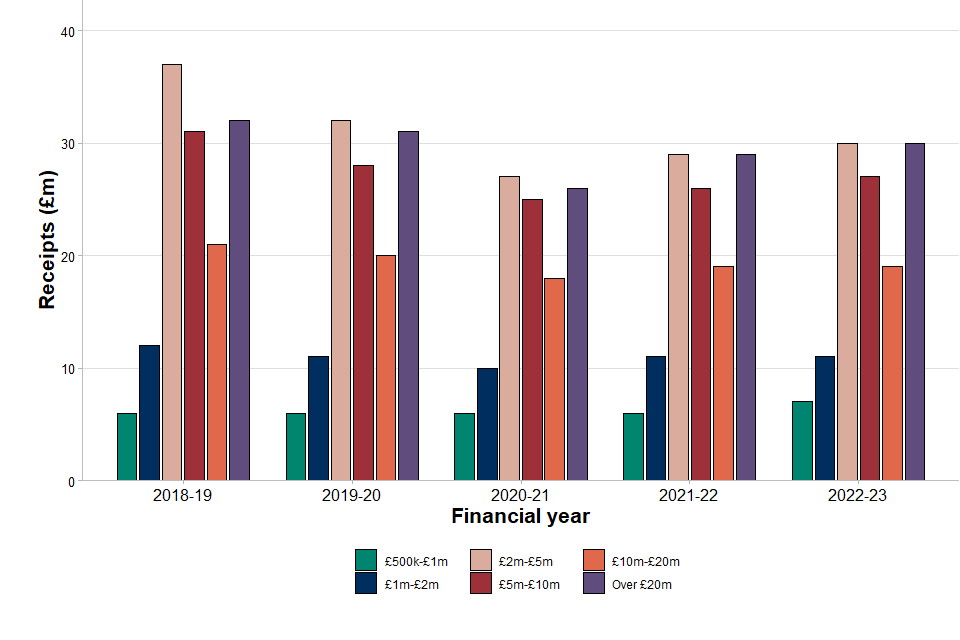
Figure 1 below shows ATED receipts by property value band between financial year 2018 to 2019 and financial year 2022 to 2023. Liable declarations include those which were liable for only part of the year, for example, when a property is sold.
Declaration numbers relate to the number of liable properties in the particular financial year, but receipts figures relate to the value of payments received in the financial year, rather than liabilities for the financial year.
Figure 1 shows that receipts for the majority of price bands increased compared to the 2021 to 2022 financial year. This follows on from increases in the previous financial year, which had followed consecutive periods of falls across all valuation bands between financial year 2015 to 2016 and financial year 2020 to 2021.
Figure 1: ATED receipts by price band
Main points
The main findings for estimated ATED receipts by band are:
-
total ATED receipts in the 2022 to 2023 financial year were £124 million, increasing by 4% (£5 million) compared to the 2021 to 2022 financial year
-
for total ATED receipts in the financial year 2022 to 2023, the majority of price bands increased compared to the 2021 to 2022 financial year. This is with the exception of the £1 million to £2 million and £10 million to £20 million price bands which remained unchanged compared to the 2021 to 2022 financial year
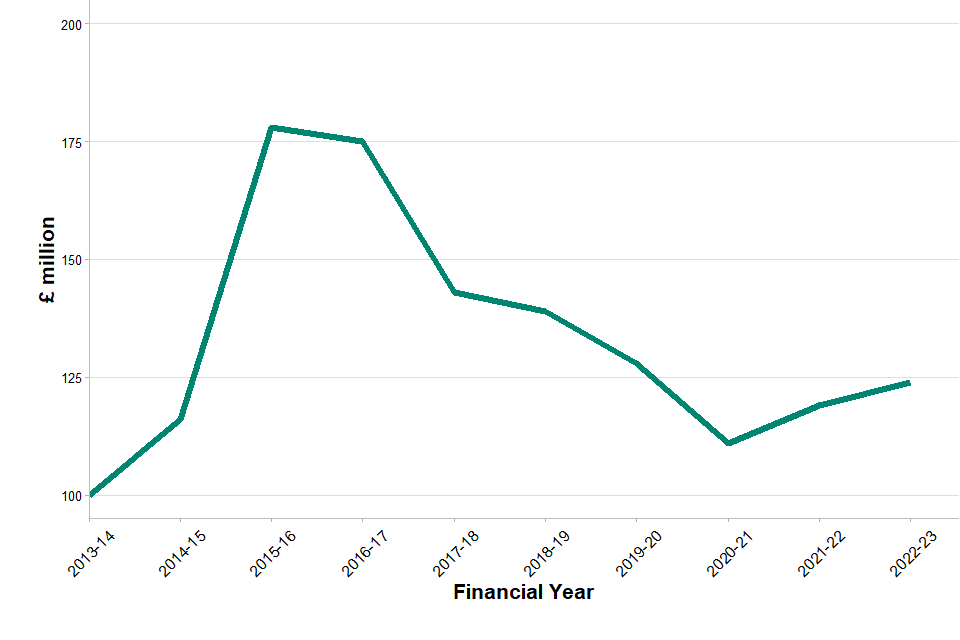
Figure 2 below shows total receipts since ATED was introduced in financial year 2013 to 2014. The figure shows that total ATED receipts peaked in the 2015 to 2016 financial year at £178 million. Total receipts then fell year on year until financial year 2020 to 2021 to £111 million. Total receipts again rose between 2020 to 2021 and the latest financial year, 2022 to 2023, to £124 million.
Figure 2: ATED total receipts
Estimated ATED liable declarations by band
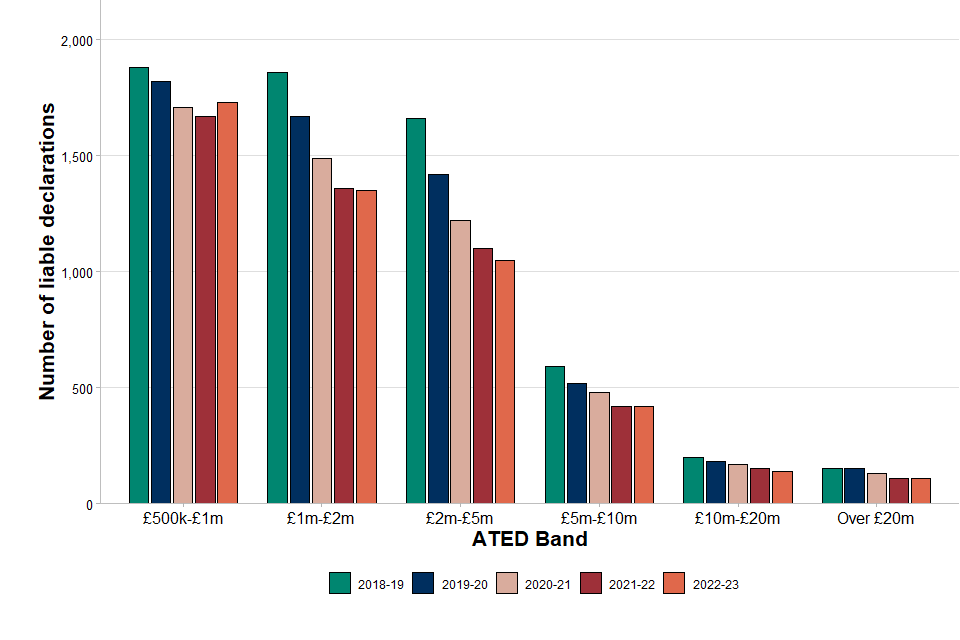
Figure 3 below shows the number of ATED liable declarations by property value band between financial year 2018 to 2019 and financial year 2022 to 2023. Liable declarations include those which were liable for only part of the year, which can occur, for example, when a property is sold. The figure shows that the number of liable returns fall or remain unchanged across all price bands for consecutive years since the 2018 to 2019 financial year, with the exception of the £500,000 to £1 million price band which saw an increase in financial year 2022 to 2023 compared to 2021 to 2022.
Figure 3: ATED liable declarations by price band
Main points
The points below illustrate a breakdown of ATED liable declarations by price band:
-
the number of ATED liable declarations marginally decreased (less than 1%) between the 2021 to 2022 financial year and the 2022 to 2023 financial year, from 4,810 to 4,800
-
for the number of ATED liable declarations in financial year 2022 to 2023, the largest change was a 7% decrease for the £10 million to £20 million price band compared to the 2021 to 2022 financial year
-
the profile of liable declarations across all price bands remained relatively consistent when compared to the previous year
ATED receipts in the UK by countries and, within England, regions
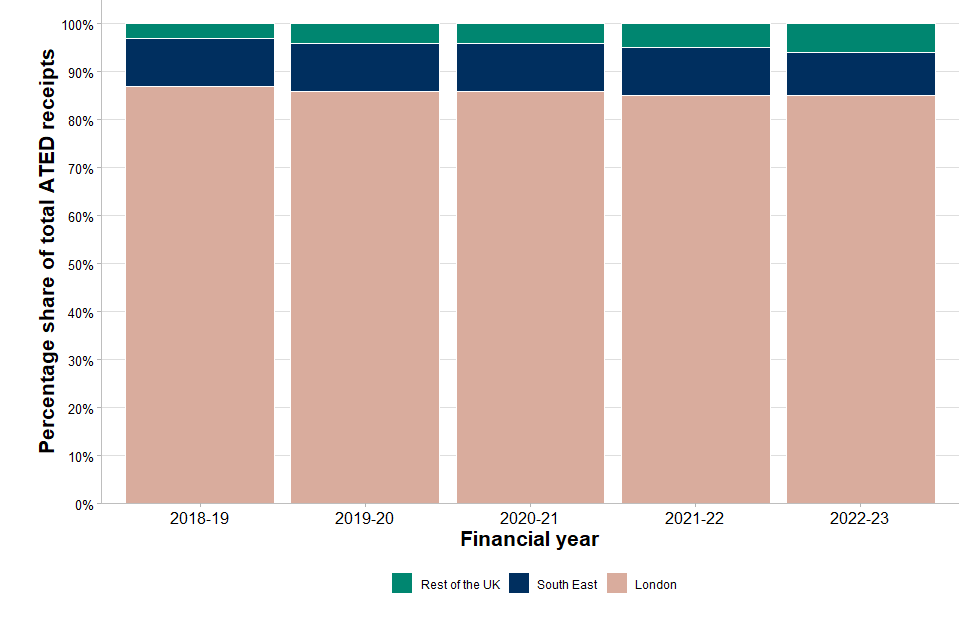
Figure 4 shows the country and, within England, regional breakdown of receipts by percentage for five financial years from the 2018 to 2019 financial year up to the 2022 to 2023 financial year. The geographical breakdown of receipts in the 2022 to 2023 financial year closely mirrors the breakdown in previous years. Though London remains the region with the largest percentage share of total ATED receipts, its percentage share had fallen since the 2018 to 2019 financial year. London’s share has remained unchanged in the latest financial year compared to the previous financial year.
Figure 4: ATED Receipts by region
Main points
The following points below illustrate a breakdown of total ATED receipts by country and, within England, region:
-
receipts from ATED declarations for properties known to be in London accounted for 85% of all receipts in the 2022 to 2023 financial year, remaining unchanged, and significantly still the highest of all regions
-
overall, the country and regional breakdown appears broadly stable when compared to previous years; with the South East at 9% of all receipts, the East of England at 2%, the South West at 1%, Scotland at 1% and the combined rest of the UK at 2%
ATED receipts by local authority
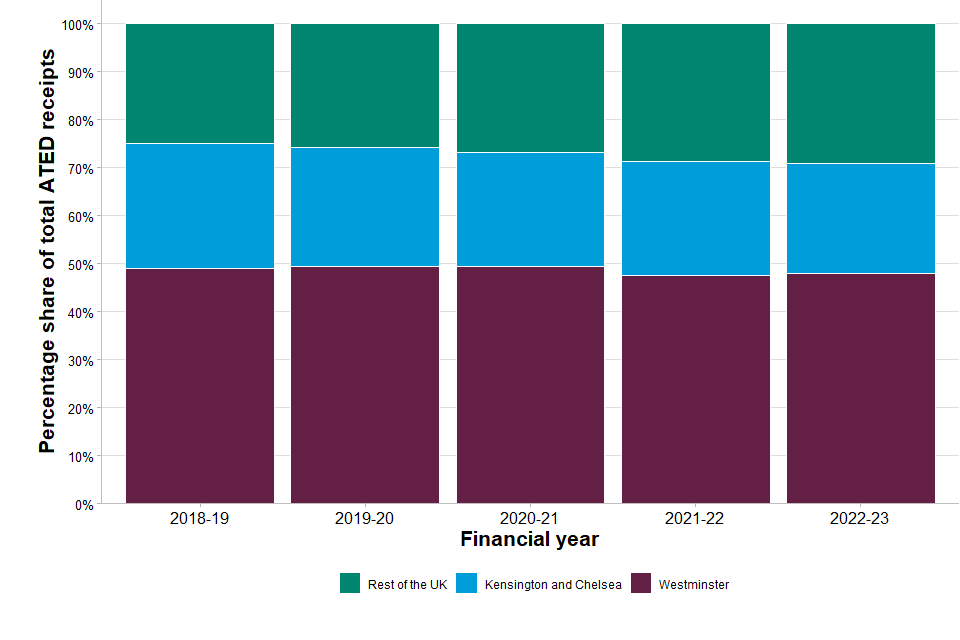
Figure 5 shows the local authority geographical breakdown of receipts by percentage for five financial years from the 2018 to 2019 financial year up to the 2022 to 2023 financial year. This shows that Westminster continues to dominate the percentage share of total ATED receipts, though that share has fallen slightly since the 2018 to 2019 financial year, this is followed by Kensington and Chelsea (another London local authority).
It is not possible to provide a comprehensive breakdown of receipts for all local authorities in the UK as this would breach HMRC’s policy on disclosure and taxpayer confidentiality.
Figure 5: ATED receipts by local authority
Main points
The points below illustrate the geographical breakdown by local authority:
-
ATED receipts continued to be highest within the London Borough of Westminster, accounting for 48% of ATED receipts in the 2022 to 2023 financial year, remaining unchanged when compared to the 2021 to 2022 financial year
-
a further 23% of receipts came from declarations in the London local authority of Kensington and Chelsea, decreasing by 1 percentage point compared to the 2021 to 2022 financial year
ATED relief declarations by type
There are a number of reliefs available which may reduce a non-natural person’s ATED liability to nil. These are claimed by stating on the ATED return the relief that applies. Any changes to the relief status of a property must be stated on a new return.
It is not possible to provide a full breakdown of relief type claims as this would breach HMRC’s policy on disclosure and taxpayer confidentiality.
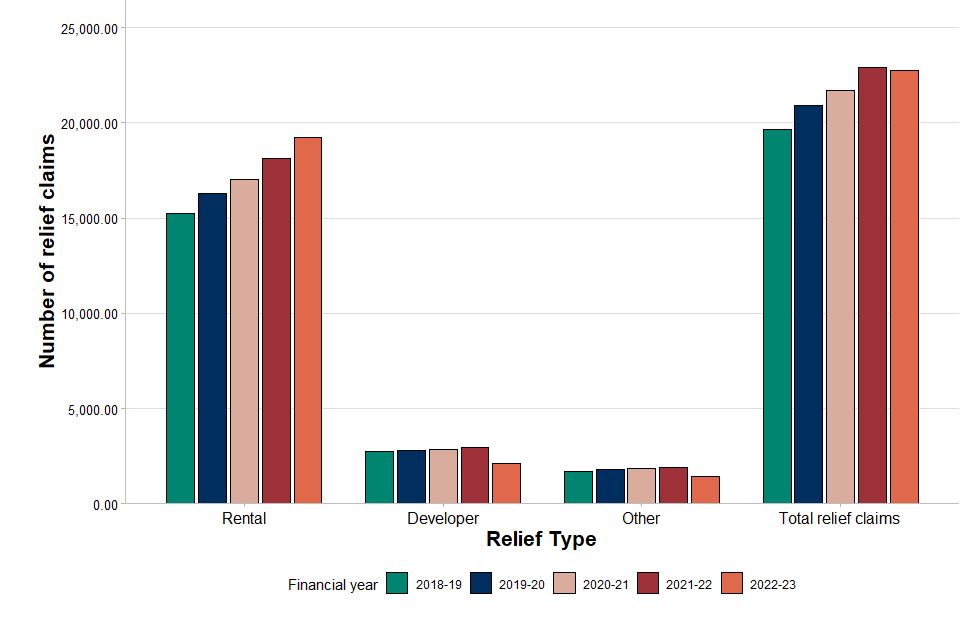
Figure 6 shows the number of ATED relief declarations for five financial years from the 2018 to 2019 financial year up to the 2022 to 2023 financial year. Total relief claims saw consecutive increases until 2021 to 2022, but fell in 2022 to 2023. This fall is attributed to a decrease in developer and other relief type claims. Rental relief claims increased in the latest financial year.
Figure 6: ATED relief declarations by type
Main points
The main findings are:
-
there was a total of 22,770 relief declarations in the 2022 to 2023 financial year, marginally decreasing (less than 1%) compared to the 2021 to 2022 financial year
-
the type of relief comprising the largest share of relief declarations is rental relief, which accounts for 84% of all relief claims. Rental relief claims saw a 6% increase in number of claims in the financial year 2022 to 2023 compared to financial year 2021 to 2022
-
the next highest share of relief claims was the developer relief accounting for 9% of total claims, with the number of claims decreasing by 28% when compared to the 2021 to 2022 financial year
-
the ‘other’ relief categories account for 6% of total claims, with the number of claims decreasing by 23% when compared to the 2021 to 2022 financial year
Contact information
If you have any queries relating to this publication, please e-mail the stamp taxes inbox.
Please see the stamp duties statistics collection for all related statistics.