Statistics of government revenues from UK oil and gas production July 2022
Updated 27 September 2023

© Crown copyright 2023
This publication is licensed under the terms of the Open Government Licence v3.0 except where otherwise stated. To view this licence, visit nationalarchives.gov.uk/doc/open-government-licence/version/3 or write to the Information Policy Team, The National Archives, Kew, London TW9 4DU, or email: psi@nationalarchives.gov.uk.
Where we have identified any third party copyright information you will need to obtain permission from the copyright holders concerned.
This publication is available at https://www.gov.uk/government/statistics/government-revenues-from-uk-oil-and-gas-production--2/statistics-of-government-revenues-from-uk-oil-and-gas-production-july-2022
1. About this release
This publication contains statistics of government revenues from UK oil and gas production.
2. Key findings
The headline findings in this year’s publication are that:
-
total Government revenues from UK Oil and Gas production were £1.4 billion in the tax year 2021 to 2022, compared to £0.3 billion in the previous year, an increase of £1.1 billion
-
Offshore Corporation Tax payments, including Ring Fence Corporation Tax (RFCT) and Supplementary Charge (SC), increased by £1.4 billion year-on-year in net terms (net of repayments) to £1.9 billion in 2021 to 2022
-
the increase in revenue in 2021 to 2022 is mainly driven by the increase in energy prices due to global supply and demand factors. At the start of 2020 to 2021 oil prices fell to their lowest levels since 2001 to 2002, before slowly recovering in the second half of 2020 as the economy began recovering from the pandemic. This recovery has continued into 2021 and gained further momentum into 2022. The deterioration in the security of global energy supply has also been a factor increasing energy prices
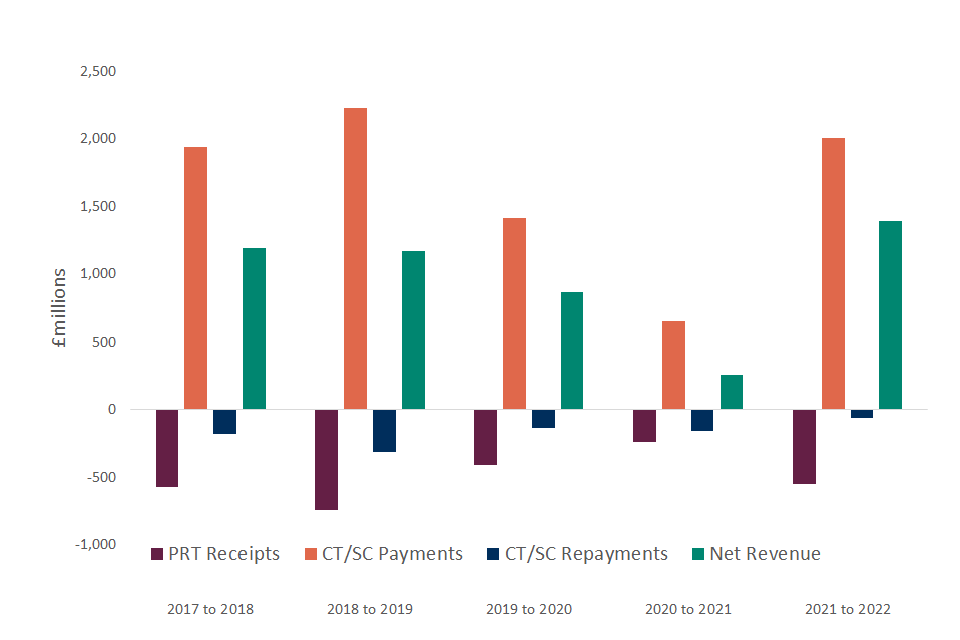
Chart 1 shows the amounts of oil and gas tax revenues paid to the UK Exchequer in the last 5 financial years (2017 to 2018 to 2021 to 2022 inclusive). For each year it gives the overall net revenue amount, as well as its constituent parts.
Key observations from Chart 1 are:
-
Petroleum Revenue Tax (PRT) receipts have been negative throughout the period. Since its rate was set to zero in 2016, practically all PRT receipts now relate to repayments and appear as negative receipts. PRT repayments peaked at close to £750 million in 2018 to 2019 before declining to £408 million in 2019 to 2020 and then to £250 million in 2020 to 2021. 2021 to 2022 saw an increase in PRT repayments to £552 million. This is not surprising as the North Sea Transition Authority (NSTA) forecast an increase in decommissioning spend in 2021-22. Only the fields given development consent before 15 March 1996 are liable for PRT, and mature fields are more likely to be involved in decommissioning activities. Therefore, the increase in decommissioning activity and expenditure affects PRT-liable fields more and explain the increase in PRT repayments
-
Offshore Corporation Tax (sum of Ring Fence Corporation Tax and Supplementary Charge) payments reached a peak of £2.2 billion in 2018 to 2019, falling to £0.7 billion in 2020 to 2021 as the impact of Covid-19 took hold. As demand and oil prices recovered, Offshore Corporation Tax payments increased to £2.0 billion in 2021 to 2022
-
net revenues hovered around £1.2 billion in both 2017 to 2018 and 2018 to 2019, before falling back to £0.9 billion in 2019 to 2020 and to £0.3 billion in 2020 to 2021, as energy prices declined due to reduced demand during the Covid-19 pandemic. In 2021 to 2022, demand recovered compared to the preceding year and geopolitical factors pushed energy prices up, leading to increased net revenues of £1.4 billion
Chart 1: Government oil and gas revenues from UK Continental Shelf (UKCS)
3. Publication information
Information about the publication is listed below:
- Theme: The economy
- Released July 2022
- Frequency: Annual
- Next release: Summer 2023
- Media Contact: HMRC Press Office 03000 585 158
- Statistical Contact: ct.statistics@hmrc.gov.uk
- Media Enquiries: HMRC Press Office 03000 585 158 hmrc.communications@hmrc.gov.uk
4. Key statistics
Corporation Tax Receipts
Net Offshore Corporation tax receipts (payments minus repayments), composed of Ring Fence Corporation Tax (RFCT) and the Supplementary Charge (SC), increased by 291% from £0.5 billion in 2020 to 2021 to £1.9 billion in 2021 to 2022. This reflects a significant increase in the Offshore Corporation Tax payments (206%) and a decrease in repayments (62%).
Losses can be carried back against historical profits to obtain a repayment of previous tax paid.
Petroleum Revenue Tax Receipts
PRT repayments were £0.6 billion in 2021 to 2022, an increase of £0.3 billion compared to 2020 to 2021. Loss-making fields can carry their losses back to relieve profits and tax paid in previous years, subject to time limits and strict ordering.
With effect from 1 January 2016, the PRT rate was reduced to 0% and PRT receipts have since been zero.
Historic revenues from UK Oil and Gas production
Government revenues from UK oil and gas production have decreased significantly over the last decade. From 2016, the rate of PRT was permanently set to zero and SC was reduced to 10%. This, together with the general maturing of the oil and gas fields in the UK Continental Shelf (UKCS), resulted in reducing Government revenues from oil and gas production.
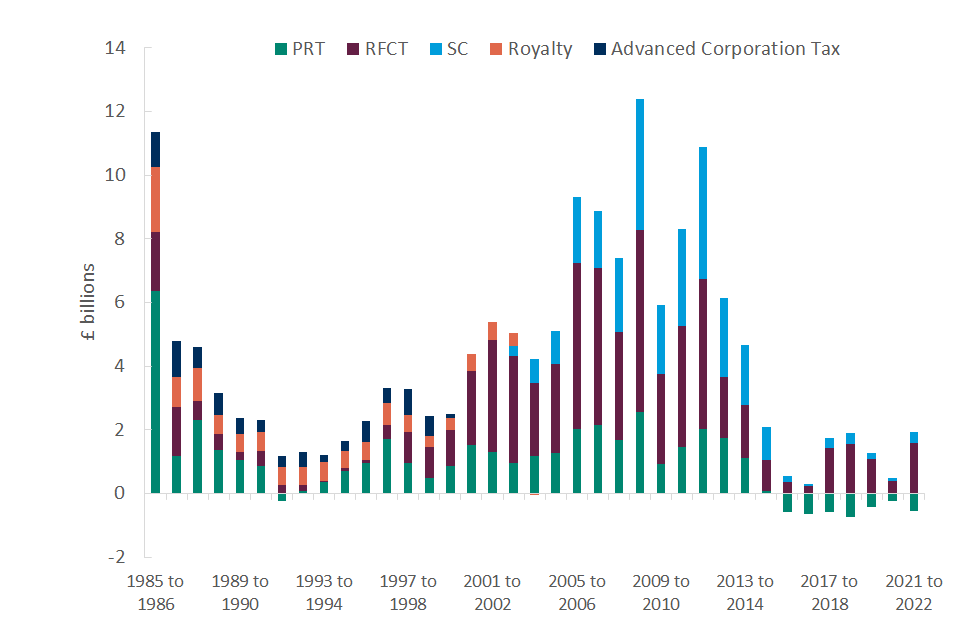
Revenues from oil and gas production peaked in tax year 2008 to 2009 and have generally decreased since. Chart 2 shows how net revenues have fluctuated since 1985 to 1986 until 2021 to 2022.
Key observations from Chart 2 are:
-
government revenues from UK oil and gas production have decreased significantly over the last decade, from £11.3 billion in 1985 to 1986 to £1.4 billion in 2021 to 2022
-
the overall profile is characterised by 3 periods: sharp decline in revenues after the initial peak in 1985 to 1986; gradual recovery in revenues between 1993 to 1994 and 2008 to 2009, when the receipts peaked; and a general decline since then, despite a second peak in 2011 to 2012
-
total net revenues fell below zero (i.e., repayments exceeding payments) for the first time in 2015 to 2016 and again in 2016 to 2017. This was followed by a modest recovery with net revenues reaching £1.2 billion in both 2017 to 2018 and 2018 to 2019, before falling back again to £0.9 billion in 2019 to 2020 and £0.3 billion in 2020 to 2021. Revenues in 2021 to 2022 recovered to £1.4 billion
Chart 2: Historic UK government net revenues from oil and gas production in the UKCS
5. Oil price, production and expenditure
Oil price continues to influence producers’ spending decisions (e.g., investment), thus impacting oil and gas tax revenues directly and indirectly.
Chart 3 shows illustrative line graphs for production, expenditure, and the oil price over time (calendar years), indexed at year 2000 (to 100).
Key observations from Chart 3 are:
-
sterling-denominated oil prices peaked in 2012, followed by a decline over 2013 to 2016 and a recovery over 2017 to 2018. Prices dipped slightly in 2019, then even further in 2020 to levels less than 50% of those seen in 2012 before recovering in 2021 to similar levels to those seen in 2018 and 2019
-
expenditure by the oil and gas operators in the North Sea appears to be tracking oil price closely since 2004, albeit with a small lag. Expenditure at the end of 2021 was less than 50% of the level seen in the peak year of 2014
-
production profile seems to be more stable compared to oil prices and expenditure. It peaked in 1999 before steadily declining through to 2014. It remained mostly flat since then but declined roughly 17% in 2021
Chart 3: UK oil and gas production, Sterling oil price and total expenditure by operators
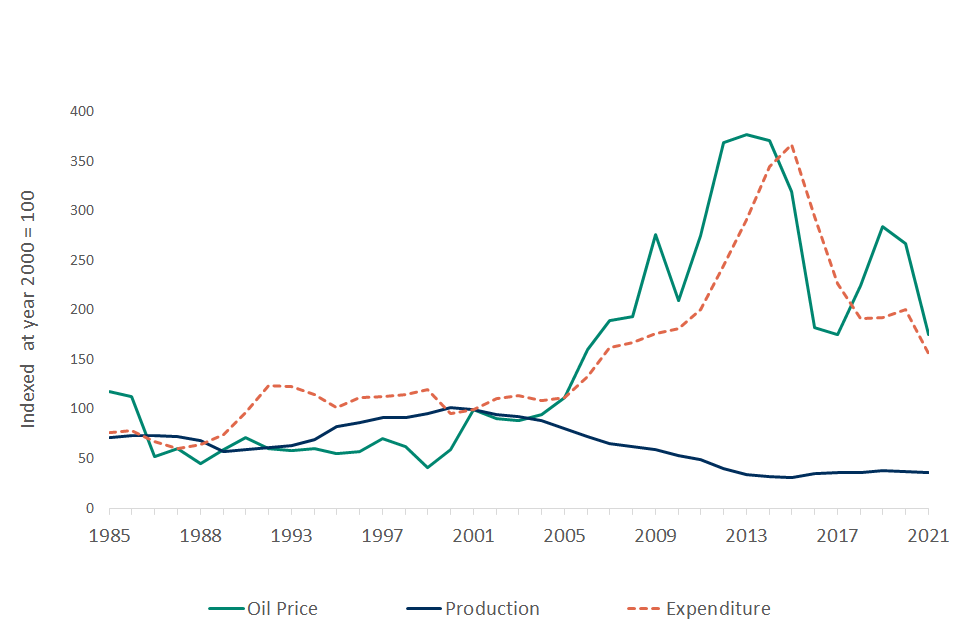
Source : NSTA, Bank of England, WorldBank
Following the fall in the oil price over the 2014 to 2016 period, expenditure declined sharply, albeit with a small lag, over 2015 to 2017. The growth of US shale oil production together with the decision by the Organisation of the Petroleum Exporting Countries (OPEC) to maintain a high level of output played a key role in this decline in oil prices.
From 2017 expenditure has seen modest year-on-year increases until 2019. However, in early 2020 producers responded to the oil price falls and drop in consumer demand by cutting their spending back sharply. Despite the recovery in energy prices operators appeared to have remained cautious going into 2021 and expenditure remained subdued, showing a modest 5% increase year-on-year.
6. Exchequer liability from decommissioning
Every year in its Annual Report and Accounts, HMRC makes an estimate of the Exchequer liability in UKCS, estimated as the appropriately discounted sum of all forecast decommissioning repayments over the expected lifetime of the North Sea oil and gas fields. Using NSTA’s central estimate for remaining decommissioning costs, due to be published in August 2022, HMRC made a provision estimate of £10.4 billion in the 2021 to 2022 Annual Report and Accounts.
7. Definitions
How is Corporation Tax applied to oil and gas companies?
This is calculated in the same way as the standard Corporation Tax applicable to all companies but with the addition of a ‘ring fence’ and the availability of 100% first year allowances for virtually all capital expenditure. The ring fence prevents taxable profits from oil and gas extraction in the UK and UK Continental Shelf (UKCS) being reduced by losses from other activities or excessive interest payments. The current rate of tax on ring fence profits is 30% and is set separately from the rate of mainstream Corporation Tax.
What is Supplementary Charge?
This is an additional charge on a company’s ring fence profits (but with no deduction for finance costs). With effect from 1 January 2016 the rate is 10%.
What is Petroleum Revenue Tax?
This is a field-based tax charged on profits arising from oil and gas production from individual oil and gas fields which were given development consent before 16 March 1993. With effect from 1 January 2016, the PRT rate was reduced to 0% (previously the rate was 50%). PRT is a deductible expense in computing profits chargeable to ring fence corporation tax and supplementary charge.
What is Energy Profits Levy?
From 26 May 2022 until the end of 2025, oil and gas companies will pay an Energy Profits Levy (EPL), rated at 25%. The tax base will be similar to that of Ring Fence Corporation Tax but with some adjustments and restrictions. For example, finance and decommissioning costs cannot be included in the calculation of EPL, and companies are not allowed to carry historical losses forward to reduce their EPL liabilities. The Levy includes an additional investment allowance of 80%, that can be claimed at the point of investment.
Further details on the Levy are available on its GOV.UK fact sheet.